
The North Star Metric: A Simple Guide
A guide to finding clarity, focus, and strategic direction through your product’s most important metric.


Introduction
In a world of growing complexity, successful founders (as well as product and growth teams) must orient themselves toward clarity. One of the most useful tools to do this is the North Star Metric — a single guiding measurement that captures the value your product delivers to users and aligns your team around long-term success.
But metrics are only meaningful if they connect back to deeper thinking: assumptions, hypotheses, experimentation, and strategic bets. This post will explore North Star Metrics through a first principles lens: why it matters, how to construct it, and what separates a good NSM from a misleading one.
Why North Star Metrics Exist
Products are complex systems. They involve users, behaviors, teams, markets, and technologies. Complexity breeds ambiguity. Without a clear focal point, teams optimize for what’s local, convenient, or visible — not necessarily what matters most.
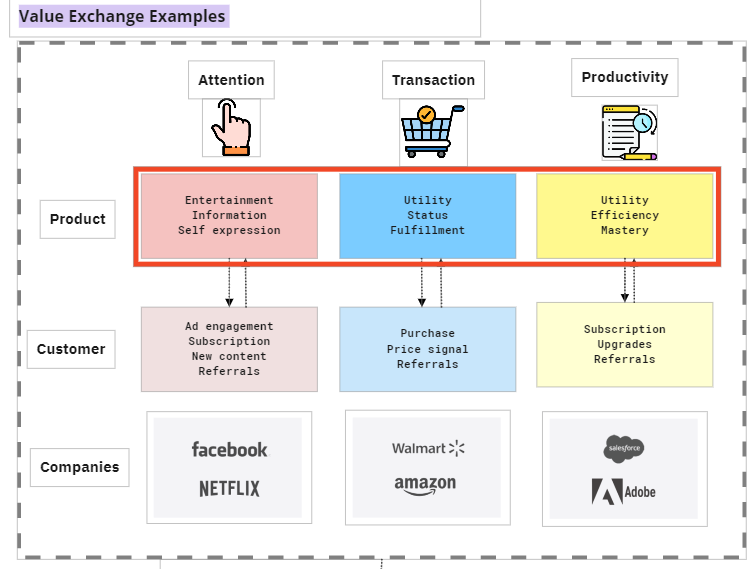
A North Star Metric simplifies this complexity by anchoring everything around a value exchange:
Your product exists to create value for customers. The NSM is a leading indicator that this value is being delivered.
At its core, every business is in the business of value creation. If we define customer value clearly and deliver it reliably, business outcomes (revenue, retention, growth) tend to follow.
The North Star Metric helps teams:
Focus on what matters most
Align cross-functional work
Track progress toward product-market fit
Guide experimentation and roadmap priorities
The Anatomy of a Good North Star Metric
A useful NSM must satisfy three core criteria:
Measures value realized: It reflects a customer actually receiving value — not just activity or usage.
Leading indicator of success: When it moves up, long-term business outcomes improve.
It’s actionable: Teams can take action to influence it via product work (not marketing or macro forces).
Common Mistakes
Measuring vanity: DAUs or registered users don’t tell you if value is delivered.
Lagging too far: Revenue is important, but it lags behind behavioral signals.
Not measurable : We should easily be able to instrument our products to track it. "Engagement" is not useful without specificity.
Unfocused: Not tied to the company vision and strategy.
Good Examples
Spotify: Time spent listening per user per week
Instacart: Total monthly groceries delivered on time
Amplitude: Total weekly users who share insights (e.g., charts or dashboard) that are consumed by at least two others. Denoted as Weekly Learning Users (WLUs).
Duolingo: Number of completed language lessons per user per week
Each of these measures:
A behavior that signals real value
A quantity that compounds
An activity tightly tied to user outcomes and business performance
Designing Your North Star Metric
Step 1: Define Customer Value
Ask: What does a successful outcome look like for our user? Be specific. Is it saving time, gaining insight, completing a task?
The north star metric must be derived from a true understanding of what action provides realized value to the customer. This means that “Daily Active Users” or “Registered Users” are not good metrics as they do not give you any meaningful information about what your customers value about your product. When product teams fail to establish a direct connection between customer value and the north star metric, they risk leading their business in the wrong direction.
If you removed the product, what would the user miss?
Step 2: Identify the Critical Event
Critical events represent moments when customers receive value. Identifying and tracking these events helps ensure the team is building toward what matters most.
What action proves a customer has received value?
For Zoom: Joining and completing a high-quality meeting
For Substack: Publishing a post or subscriber reading one

Step 3: Choose a Metric that Captures It
A good NSM has a formula:
NSM = Reach x Frequency x Depth x Quality
Where:
Reach: How many users do it?
Frequency: How often?
Depth: What is the depth of their engagement? How intensely or with how much volume?
Quality: Was it a good experience or outcome?
Example: Uber
Reach = Number of riders
Frequency = Rides per week
Depth = Distance or total spend
Quality = 5-star ratings, low cancellations

Step 4: Decompose It Into Inputs
Once the NSM is defined, break it down into input metrics you can control and experiment against.
The inputs are just as important as the metric. These are a small set (3-5) of influential, complementary factors that you believe most directly affect the North Star Metric, and that you believe you can influence through your product offering.
For example, Instacart identified four inputs into a North Star Metric of total monthly items received on time. They need (1) lots of customers placing orders. Those orders ideally contain (2) lots of items. Instacart needs to fulfill (3) lots of orders. And (4) the orders need to be delivered on time.
Number of customers placing orders
Number of items per order
Number of fulfilled orders
Percentage of orders delivered on time
The Strategic Use of NSMs
An NSM is not just a reporting tool — it’s a strategic operating system to help with ruthless prioritization.
Use it to:
Prioritize bets: Does this initiative drive the NSM?
Make trade-offs: If an input is down but NSM is up, maybe that input is a red herring.
Frame roadmap reviews: Is each team moving a key NSM input?
Navigate ambiguity: In the absence of certainty, optimize for progress on your NSM.
From Metrics to Hypotheses
The North Star Metric helps frame what matters. But to make real progress, teams must go deeper: they must develop hypotheses — clear beliefs about how to move the metric.
Hypothesis Structure
If we [do X] for [segment Y], then [input metric Z] will increase, because [underlying causal logic].
For example:
If we introduce collaborative playlists for Gen Z users, then session length will increase, because music is a social experience for them.
This ties experimentation directly to input metrics and ultimately to the North Star Metric. It's a way of translating big ideas into testable bets.
Thinking in Bets
Every roadmap decision is a bet under uncertainty. Good bets are not just guesses — they’re structured around:
Opportunity (What is the upside if this works?)
Confidence (How well understood is this space?)
Effort (What resources will it take?)
Experimentation (Can we learn quickly?)
Bets can be categorized:
Opportunity-focused bets: Framing the space (e.g., "We believe multiplayer commerce is a meaningful shift")
Solution-focused bets: Executing on a tactic (e.g., "We’re launching shared carts to test multiplayer behavior")
Each bet should be nested in a higher-level opportunity. And each solution should include a hypothesis and measurable outcomes.
Experimentation is not just about A/B tests. It's a mindset: continuously testing assumptions, validating ideas, and reducing uncertainty.
Principles for Effective Experimentation:
Speed over precision. Early experiments are for learning, not proving.
Instrument leading indicators. Don’t wait for downstream business impact.
Design for reversibility. Bias toward tests that don’t trap you.
Fail smart. Every failure should update your model of how the product works.
Final Thought
A strong North Star framework ties together:
A long-term outcome (NSM)
A causal model (inputs and outputs)
A portfolio of hypotheses (bets)
A system of rapid learning (experiments)
This structure gives teams confidence to explore, boundaries to focus, and metrics that truly matter. It transforms product development from a collection of disconnected projects into a compounding system of bets aimed at solving real customer problems.
The best North Star Metrics aren’t chosen, they’re discovered. They emerge from deep work to understand what your product truly does for customers. And when you find them, they become more than a number. They become a lens on reality, a guide through uncertainty, and a tool for building something that matters.